WEEK 12Monday and Wednesday

Observability and Debugging

Week 12 · Seeing inside Project Pulse after it ships
WEEK 12Monday and Wednesday

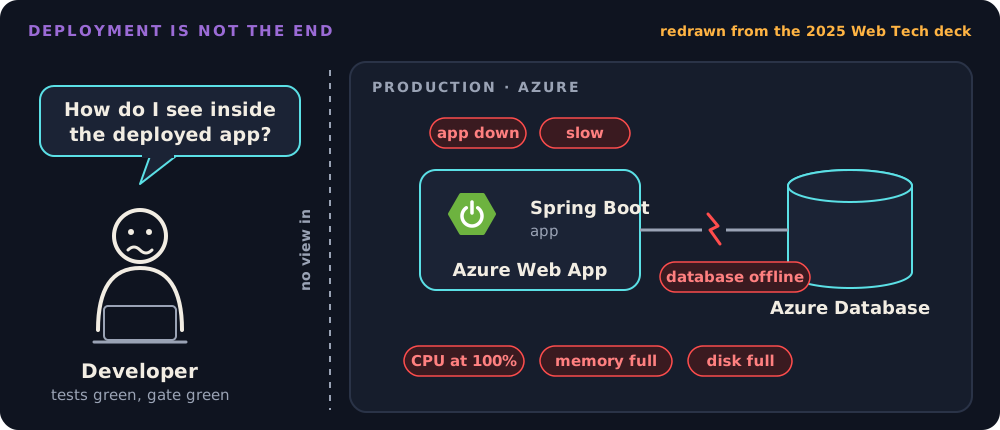
Deployment is not the end

A developer outside the production panel asks how to see inside the deployed app, while inside the app goes down, gets slow, loses its database, and runs out of CPU, memory, or disk

WEEK 12Monday and Wednesday

Nobody could tell if it was up

  • October 1, 2013: HealthCare.gov launches and breaks under its first traffic
  • Mid-October: about 3 in 10 visitors can get on at all
  • The rescue team finds no dashboard, "no quick way for engineers to measure what was going on"
  • "Nobody could even tell us if the system was up."
WEEK 12Monday and Wednesday

The first fix was a dashboard

  • The rescue team built the dashboard first
  • Then they could rank the problems and fix the worst ones first
  • By December 1: uptime from 43% to 95%, errors from 6% to 0.5%
Key point

You cannot fix what you cannot see.

WEEK 12Monday and Wednesday

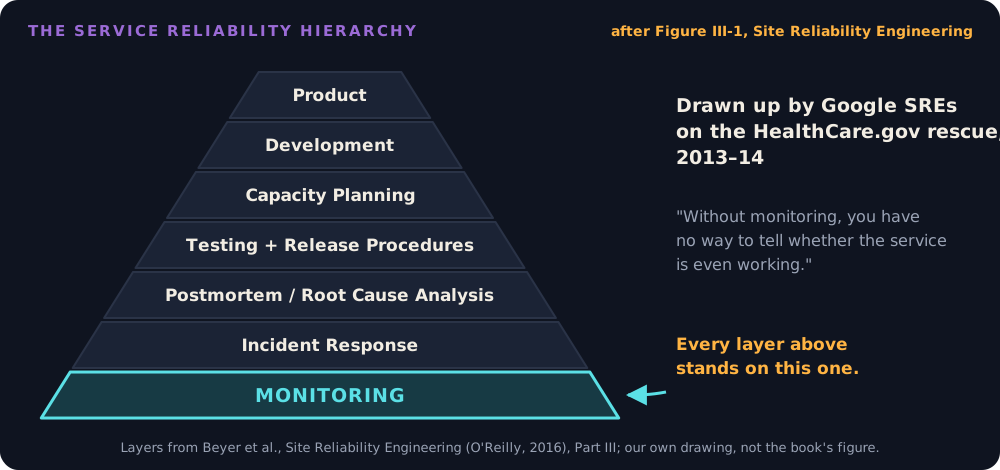
Monitoring is the base

The service reliability hierarchy as a pyramid: monitoring at the base, then incident response, postmortem and root cause analysis, testing and release procedures, capacity planning, development, and product at the top

WEEK 12Monday and Wednesday

Project Pulse would not have known either

Key point

"Production telemetry is not collected anywhere yet." Project Pulse's architecture document, until November 9, 2026

WEEK 12Monday and Wednesday

Nine months without a trace

  • January 2026: I upgrade Project Pulse from Spring Boot 3 to 4
  • Spring Boot 4 sets up tracing only through its own modules
  • Every test passes, and tracing is off
  • No trace IDs, nothing in Zipkin, for nine months
Ask the room

How would you have noticed?

WEEK 12Monday and Wednesday

That, then why

Monitoring

A few numbers you picked in advance. Tells you that something is wrong.

Observability

Asking new questions of what the system already records. Tells you why, even for a problem you never imagined.
WEEK 12Monday and Wednesday

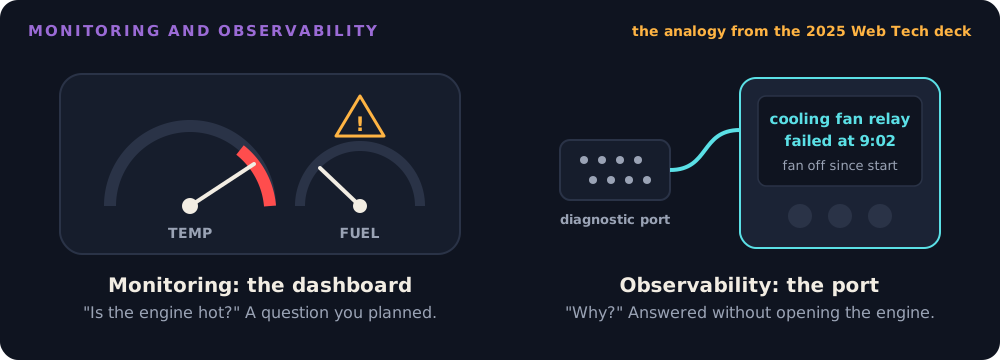
The gauge and the port

A car dashboard with the temperature gauge in the red answers a question you planned; a scanner on the diagnostic port reads out why: the cooling fan relay failed

Key point

Install the port before the breakdown, not during it.

WEEK 12Monday and Wednesday

Three kinds of telemetry

  • Metric: a number measured over and over. Tells you that something is wrong
  • Trace: one request's path, step by step. Tells you where
  • Log: a line of text about one event. Tells you why
WEEK 12Monday and Wednesday

Three of each, from Project Pulse

Metric Trace Log
http.server.requests An instructor invites two students Sent {} of {} weekly reminders
jvm.memory.used A user logs in Could not send an invitation email
hikaricp.connections.pending A student adds an activity Unhandled exception
WEEK 12Monday and Wednesday

How do you know?

"We have no errors in production." "How do you know?" "We don't log."

WEEK 12Monday and Wednesday

Actuator: the diagnostic port

Endpoint Production Your laptop
health status only each check
info version and commit plus Java and OS
metrics, prometheus not exposed admin only
loggers, env, beans not exposed admin only
WEEK 12Monday and Wednesday

Try it on production

curl https://projectpulse.team/actuator/health
curl https://projectpulse.team/actuator/info
curl https://projectpulse.team/actuator/metrics
Ask the room

The third one answers 404. Is something broken?
WEEK 12Monday and Wednesday

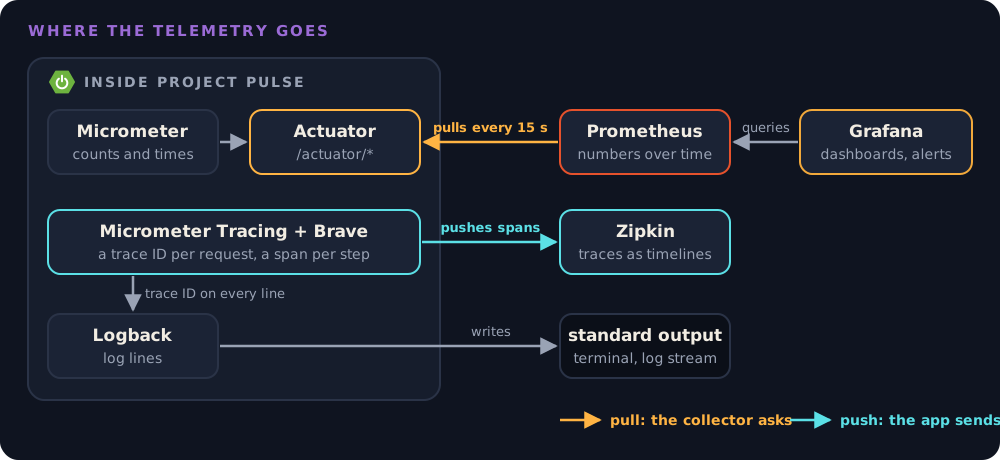
Where the telemetry goes

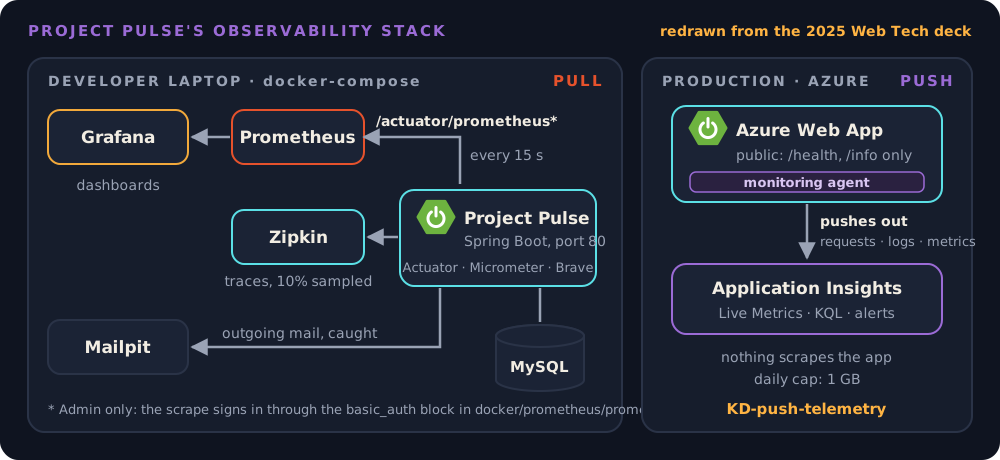
Inside Project Pulse, Micrometer hands numbers to Actuator, Brave gives each request a trace ID, and Logback writes log lines. Prometheus pulls the numbers from Actuator every 15 seconds and Grafana queries Prometheus; the app pushes finished spans to Zipkin; Logback writes to standard output with the trace ID on every line

WEEK 12Monday and Wednesday

Five dependencies, no code

spring-boot-starter-actuator            the /actuator endpoints
spring-boot-starter-micrometer-metrics  counts and times
micrometer-registry-prometheus          the Prometheus format
spring-boot-micrometer-tracing-brave    trace IDs and spans
spring-boot-starter-zipkin              sends spans to Zipkin
WEEK 12Monday and Wednesday

A dashboard reads a collector

/actuator/metrics

A window for one person's spot check. No history.

A collector

Keeps the history. Pulls from a private endpoint, or the app pushes to it.

Key point

The public site does not serve its metrics.

WEEK 12Monday and Wednesday

Logs go to standard output

  • The app writes to standard output; the platform collects it
  • Project Pulse: Logback's console output, no log files
  • Azure App Service: the log stream
Key point

Find your platform's log stream before the first incident.

WEEK 12Monday and Wednesday

Written for a machine

09:02:14 ERROR [6af11fb6...-0860298d...] UserInvitationService : Could not send an invitation email for section 2 of course 1
{"log":{"level":"ERROR", "logger":"team.projectpulse.user.userinvitation.UserInvitationService"},
 "message":"Could not send an invitation email for section 2 of course 1", "traceId":"6af11fb6..."}
WEEK 12Monday and Wednesday

One ID per request

  • A request arrives; Brave gives it a trace ID
  • Every log line that request writes carries the ID, in every class
  • One search for the ID returns the whole story
Key point

That is how you find one failure among thousands of lines.

WEEK 12Monday and Wednesday

Change the level, no redeploy

curl -X POST localhost/actuator/loggers/team.projectpulse.user \
  -H "Authorization: Bearer $TOKEN" \
  -H 'Content-Type: application/json' -d '{"configuredLevel":"DEBUG"}'
WEEK 12Monday and Wednesday

Metrics have tags

/actuator/metrics/http.server.requests
/actuator/metrics/http.server.requests?tag=uri:/api/v1/students&tag=status:500

Counter

Only goes up: invitations sent

Gauge

A value right now: threads alive

Timer

How long, and how often: @Timed

WEEK 12Monday and Wednesday

The four golden signals

Signal Project Pulse metric
Latency http.server.requests, by uri and status
Traffic http.server.requests count
Errors outcome SERVER_ERROR, plus wrong answers
Saturation memory, threads, pending database connections
WEEK 12Monday and Wednesday

Machines and business

Machine metrics

Memory, threads. Is the system struggling?

Business metrics

Reports submitted before Monday's deadline. Is it doing its job?

WEEK 12Monday and Wednesday

Count it yourself

try {
    this.emailService.sendInvitationEmail(userInvitation);
    meterRegistry.counter("invitations.sent", "outcome", "success").increment();
} catch (RuntimeException e) {
    LOGGER.error("Could not send an invitation email for section {} of course {}", sectionId, courseId, e);
    meterRegistry.counter("invitations.sent", "outcome", "failure").increment();
}
WEEK 12Monday and Wednesday

What does this number measure?

  • Only requests that reached the application
  • Starts at zero on every deploy and restart
  • Once it becomes a target, people improve the number instead of the thing

HTTP 200 OK, body {"error": "database on fire"}. Error rate: 0%.

WEEK 12Monday and Wednesday

Your SLO, measured

Source Misses
The platform's request and 5xx counts wrong answers with a 200
An outside probe, every minute what the health check doesn't check
The app's own metric requests that never arrived; restarts
WEEK 12Monday and Wednesday

95 of every 100 views

management:
  metrics:
    distribution:
      percentiles:
        http.server.requests: 0.95
Pitfall

A percentile cannot be averaged across instances.

WEEK 12Monday and Wednesday

A probe that cannot fail

curl -s -o /dev/null -w '%{http_code} %{content_type}' https://projectpulse.team/health

200 text/html: the single-page app, not the health check.

Key point

Check the content type, too. An SLI that cannot fail measures nothing.
WEEK 12Monday and Wednesday

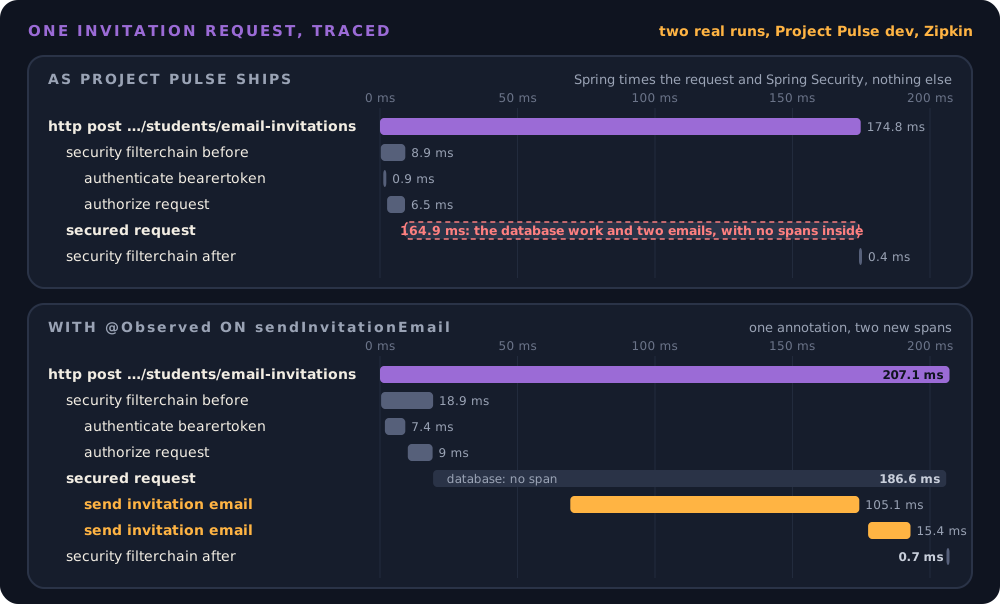
Traces and spans

  • A trace is one request's journey
  • A span is one step: when it started, how long it took, which step called it
  • Across five services, only the trace shows which one was slow
WEEK 12Monday and Wednesday

One invitation request, traced

Two Zipkin traces of the same invitation request on Project Pulse dev. Top, as shipped: the HTTP span, Spring Security's token and authorization spans, and one 164.9 ms secured request span with nothing inside it. Bottom, with @Observed on the email method: inside the secured request, about 50 ms with no span for the database work, then two send invitation email spans of 105.1 ms and 15.4 ms

Ask the room

In the top trace, where did the 165 milliseconds go?

WEEK 12Monday and Wednesday

A trace shows what someone instrumented

@Observed(name = "email.send", contextualName = "send invitation email")
public void sendInvitationEmail(UserInvitation userInvitation) {
Key point

No span, no answer. Spring Boot does not time queries or mail on its own.

The outage is always in the span you didn't add.

WEEK 12Monday and Wednesday

Turn the annotation on

management:
  observations:
    annotations:
      enabled: true
WEEK 12Monday and Wednesday

Keep one in ten

management:
  tracing:
    sampling:
      probability: 0.1
Ask the room

A student reports one failed request. What can you still find?

WEEK 12Monday and Wednesday

September 6, 2026

  • Project Pulse's /actuator/env answers any anonymous caller
  • It returns the database and mail passwords
  • The settings came from a local development tutorial and applied to every profile
Pitfall

The diagnostic port is a port for anyone else, too.

/actuator/env: the most helpful endpoint on the internet. It answers every question, for everyone.

WEEK 12Monday and Wednesday

The fix, in application.yml

management:
  endpoints:
    web:
      exposure:
        include: health,info        # the base for every profile
  endpoint:
    health:
      show-details: when-authorized # details for an admin only
      roles: admin
  info:
    git:
      mode: simple                  # the commit, not the JVM version
    java:
      enabled: false
    os:
      enabled: false
WEEK 12Monday and Wednesday

Is the app down?

  • November: staging's health says DOWN
  • The cause: a stale mail password in staging's Key Vault
  • Mail was broken. Everything else worked
Ask the room

Should a broken mail server make the whole app "down"?

WEEK 12Monday and Wednesday

Liveness and readiness

Liveness

Is the process stuck? Restart it.

/actuator/health/liveness

Readiness

Can it serve traffic now? Send requests elsewhere until it can.

/actuator/health/readiness

Key point

Point a platform's probe at one of these, never at /actuator/health.

Alive but not ready: me at 8 a.m. before coffee. Don't restart me, just wait.

WEEK 12Monday and Wednesday

Monday's takeaways

  • A metric says something is wrong, a trace says where, a log says why
  • Logs to standard output, with a trace ID on every line
  • Before you trust a number, say what it misses
  • A trace shows only what someone instrumented
  • Management endpoints are attack surface
WEEK 12Monday and Wednesday

Wednesday: the lab

Project Pulse on a laptop · you call out where to look

WEEK 12Monday and Wednesday

Who is asking?

Path Requests Looking for
/.gitlab-ci.yml 21 Secrets in a pipeline file
/.env.openai, /.env.aws 13 API keys
/.git/hooks/post-receive, /.hg/requires 14 The repository
/l9owrv.php, /well.php, /wp-admin.php 24 Someone else's back door
/vite.config.js, /webpack.json, … 43 How the frontend is built
/robots.txt 8 Nothing bad
WEEK 12Monday and Wednesday

Reading the numbers

  • Dashboard: 583 of 1,979 requests failed. 29%!
  • Rows or requests? 1,564 rows stand for 1,979. Sum itemCount
  • What failed? Every 4xx counts: 574 were 404s, mostly bots
  • What should the SLI count? Our errors, 5xx: 99.95%
WEEK 12Monday and Wednesday

Debugging from evidence

  • Narrow it down with a metric: when, and which route?
  • Find one failing request by its trace ID
  • Give the agent the evidence, not the symptom
  • Reproduce it with a failing test
  • Fix, then watch the metric return to normal
WEEK 12Monday and Wednesday

Evidence, not the symptom

The agent

"Users get a 500 on the report page." The agent will guess, fluently.

Key point

Give it the stack trace, the request, and the commit that deployed at 9:02.

WEEK 12Monday and Wednesday

Where this work lives

Site reliability engineer

Chooses what to watch, carries the pager, runs incidents, writes the blameless postmortem, sets SLOs.

Also called

DevOps engineer, platform engineer, production engineer.

WEEK 12Monday and Wednesday

The agent and your telemetry

Delegate

Scan thousands of log lines. Correlate a spike with a deploy. Draft the structured-logging config.

Keep

What to watch, what to promise the client, what may never appear in a log.

The agent

Asked to "add logging," an agent logs request bodies, emails, and tokens. Grep your logs for an email address.
WEEK 12Monday and Wednesday

1. Tour Actuator

  • Log in as the seeded admin, copy the token
  • /actuator, /actuator/health, /actuator/metrics/http.server.requests
  • Raise one logger to DEBUG, no restart
WEEK 12Monday and Wednesday

2. Read the dashboard

  • Availability, errors, uptime: what does each number count?
  • Grafana stores nothing. Where do the numbers come from?
  • The scrape signs in as the admin. Without that: 401. Why?
  • Two alerts email Mailpit: any 5xx, any ERROR line
WEEK 12Monday and Wednesday

How production does it

Project Pulse's observability stack. On a developer laptop, Prometheus pulls from the app's /actuator/prometheus every 15 seconds, signed in as the admin, Grafana draws it, Zipkin receives traces, and Mailpit and MySQL run beside the app. In production on Azure, the app serves only /health and /info publicly, and the monitoring agent App Service attaches pushes requests, logs, and metrics out to Application Insights, where Live Metrics, KQL queries, and alerts read them

WEEK 12Monday and Wednesday

3. Stop the mail server

  • Add the @Observed line, sampling to 1.0, send an invitation
  • Stop the Mailpit container
  • Send another. Does Project Pulse degrade, error, or hang?
  • The alert fires. Where is its email?

Our alert for the mail server is sent by email. What could go wrong?

WEEK 12Monday and Wednesday

4. Find the 500 on production

  • Production's first day: one 500. On which route?
  • Join everything with its operation_Id
  • Read the cause
  • Hand the agent the evidence; ask for a failing test first
WEEK 12Monday and Wednesday

One request, joined

let op = toscalar(requests
    | where timestamp > ago(2d) and resultCode == "500"
          and name == "POST /api/v1/evaluations"
    | take 1 | project operation_Id);
union requests, dependencies, exceptions, traces
| where operation_Id == op
| project timestamp, itemType, name, resultCode, message
| order by timestamp asc
WEEK 12Monday and Wednesday

Hand it to the agent

Key point

"Here is the request, the SQL, and the error from production. Explain the failure and propose a test that reproduces it. Do not fix it yet."

WEEK 12Monday and Wednesday

99.95%

Key point

The SLI called that day a success. The 0.05% was one student's work.

WEEK 12Monday and Wednesday

5. Turn one metric into an SLO

Ask the room

Pick the indicator, the target, and the window. What does your number miss?

WEEK 12Monday and Wednesday

Your week

  • Choose your SLO's source and write what it misses under the requirement
  • Make one request fail on purpose in your deployed system
  • Find its log line in the platform's log stream, not your terminal
Key point

Checkpoint 3 next week: your SLO with a measured value, and where the number comes from.

Observability and Debugging

→ space PgDn
Next step or slide
← PgUp
Back
↓ S
Skip to the next slide
O
Overview of all slides
N
Speaker notes
B
Black the screen
Ctrl+P
Print / PDF handout, one slide per page